Example 1: Simple Population Model
A simple system dynamics model can be used to show unrestricted exponential growth over time.
Viewing this model in Nova
To run this model:
- Launch Nova
- Select Menu Item
- Open folder and double-click
The model displays in Nova as shown
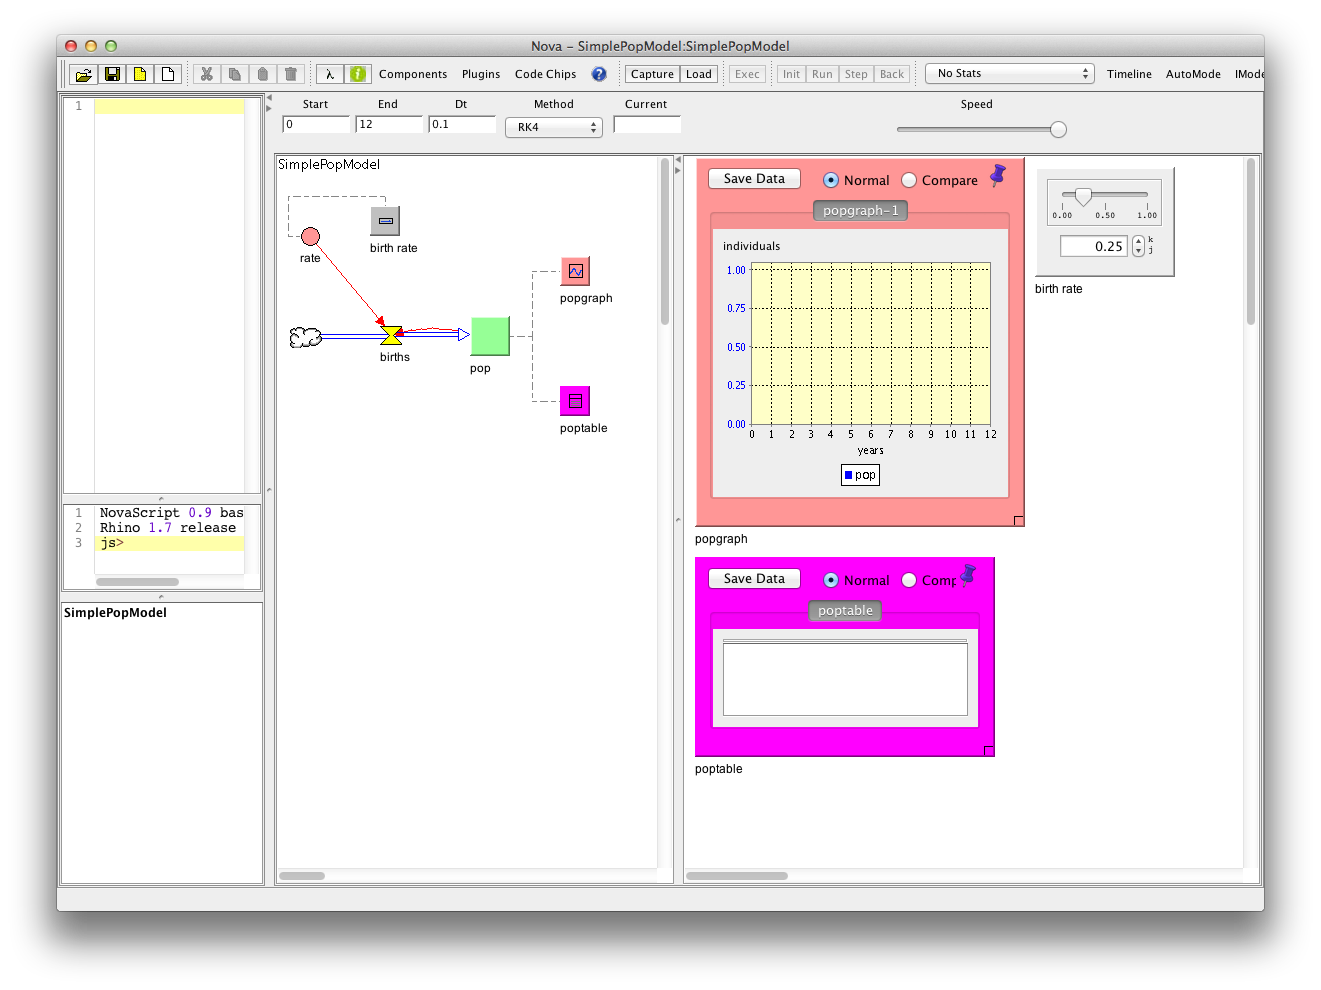
About this model
The two large central panels are called the Modeling Canvas and the Dashboard. The modeling canvas shows a graphic representation of the model as a set of interacting components. In fact, the model is constructed by placing such components on the modeling canvas, connecting them appropriately, and specifying their mathematical relationships using component expressions (not shown).
In the model, population is a stock called pop whose change is specified by a flow called birth. The birth rate is provided by the component expression rate * pop. Here is a term which represents the constant or computed quantity contained in its component expression. In this model is provided by a slider called birth_rate, which is visible in the dashboard.
Also visible in the dashboard are a graph and table for displaying model output. These each have stubs in the model canvas that show how they get their data from pop.
The mathematical model represented here is given by the differential equation: $\frac{d\ pop}{dt} = rate * pop$
Running the model
To run this model follow these steps:
Running this model:
- Click on the Capture button in the tool bar.
- Click Load next to “Capture.”
- Click Exec to run the model through multiple iterations. Click Stop to stop the run before completion.
- To run the model step by step, click Capture, Load, Init, then Step.
- To rerun the model you may omit the Capture, Load steps.
- To have the model run more slowly adjust the speed slider above the Dashboard.