CSCI 150: Lab 3
Visualizations
Due: 11:59 PM on Tuesday, March 2
The purpose of this lab is to:
- Introduce basic graphics
- Program your first visualizations!
- Practice loops using graphics
Optional Prelab
In case it is helpful, we have put together a set of completely optional prelab questions (with an answer key) that might help you work through some of the ideas related to this lab before you start doing any programming. You can find these questions here in Prelab 3.
Part 1 - Picture This
sketchy.py: 10 points, individual
Implement a Design |
Create a program called sketchy.py that draws the picture of your design using the picture module.
Using the picture moduleWe have provided you with a module picture that lets you draw pictures. To use it you need to:
More details about these functions (and others!) can be found here. Please note that drawSquare and drawSquareFill might not be working. Important NoteWe would love to create an online art gallery sharing everyone's interesting art work. On this week's Google Form, please indicate whether your are willing to have your art work included in the gallery and whether you would like your work to be attributed to you (or to "Anonymous Student"). |
Part 2 - Walk Like an Egyptian
pyramid.py: 14 points, individual
Describe the Problem |
Write a program called pyramid.py that draws a pyramid of bricks based on user input.
Input: An integer for the width of the image (width) and the height in bricks of the pyramid (n). Output: An image of a pyramid that is n bricks tall in a square canvas width wide (and thus width tall). |
Understand the Problem |
Here are three sample outputs for your reference. Notice that the pyramid doesn't necessarily fill the entire canvas to the right and to the top; if the canvas width is not evenly divisible by the number of bricks, then there will be extra blank space. (A question for you to ponder: why is there so much blank space in the third example? Seems like you could fit lots of extra bricks both to the right and up top...)
400 x 400, 3 bricks. 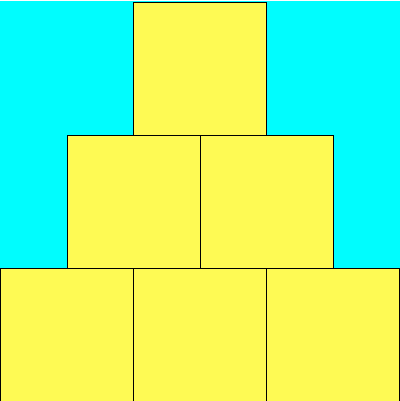
400 x 400, 17 bricks. 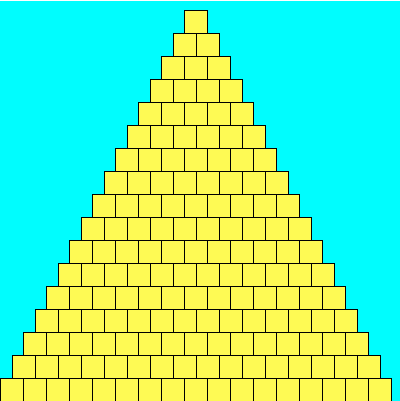
400 x 400, 123 bricks. 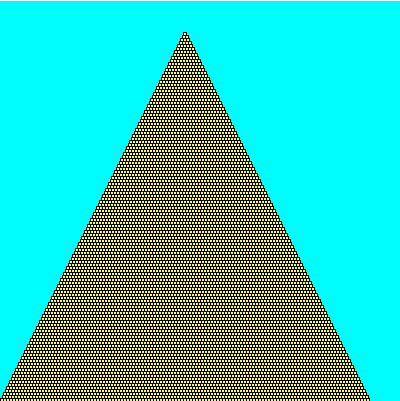
|
Design an Algorithm |
Write pseudocode to draw the appropriate pyramid. The algorithm is:
For each row i of the pyramid
Of course, this leaves a lot of details out! The first question you should answer is "How many rows are there in the pyramid?" The answer here is n (please ask if it is unclear why this is the case).
So we can rewrite the algorithm as:
For each row i from 0 to n-1 do
But drawing row i of the pyramid is a whole process in itself. To draw row i of the pyramid, we need to answer the following questions (which are also part of the optional prelab, where you can find the answer key):
For each row i from 0 to n-1 do
If we were to implement this pseudocode, we would see that all the rows would be squished up against the left-hand side of the canvas... that is, we haven't taken into account that each row itself starts a little bit further to the right than the row below it. Thus, our next questions (also from the prelab, which has an answer key):
For each row i from 0 to n-1 do
|
Implement a Design |
Now that you have a detailed algorithm in pseudocode, translate it (bit by bit!) into a Python program named pyramid.py. Although your final program should get the width and number of bricks from the user, you may want to temporarily hard-code this values into your program (using the example values above, perhaps) for now because it will make testing easier for now.
Remember you can use the notes at the top of this page to help you remember how to create a new canvas and draw rectangles on it using the picture module. |
Implementation Notes |
|
Test the Program |
Try running the program with the examples given above as well as some others. Make sure you have gaps where you ought to, and that there aren't gaps where there shouldn't be any. Your pyramid should not be sloping to one side or floating in the middle. You shouldn't have some bricks that are larger than others. If it looks fishy, go back and examine your math equations, checking that the "integer division" is being used appropriately.
Don't forget to let the user input the width and number of bricks, if you were testing the program with hard-coded values. |
Part 3 - Monte Carlo!
monte.py: 14 points, partner encouraged
If you choose to work with a partner, only one of you needs to submit a solution, but both of you should indicate your partner and who submitted a solution in your Google Form submission. You should also both read the Recurse Center's guide on pair programming before you begin.
You probably remember bumping into that peculiar number pi π = 3.14159265..., right? It comes up when you're talking about circles and trigonometry, but also appears in a bunch unexpected places that seem to have little to do with either. As a refresher, π can be defined as the ratio of a circle's circumference to its diameter. One interesting feature of π is that it's an irrational number, meaning it cannot be expressed as a fraction m/n where both m and n are integers; consequently, its decimal representation never ends or even repeats.
Since ancient times, mathematicians have been fascinated with the study of π and it's various properties. Early approximations of π, such as 22/7 and 355/113 were accurate to 3 and 7 digits repsectively (the latter approximation was the best known for nearly a millenium). Currently, more than the first trillion (a million million) digits are known. There are many ways to estimate π — for example, you could draw as precise a circle as you can manage, measure its circumference C and diameter d, and then divide C/d; this should give you π. Alternatively, there is a geometry-based approach due to Archimedes. We'll investigate a third approach using what is called a Monte Carlo method.
Monte Carlo Method
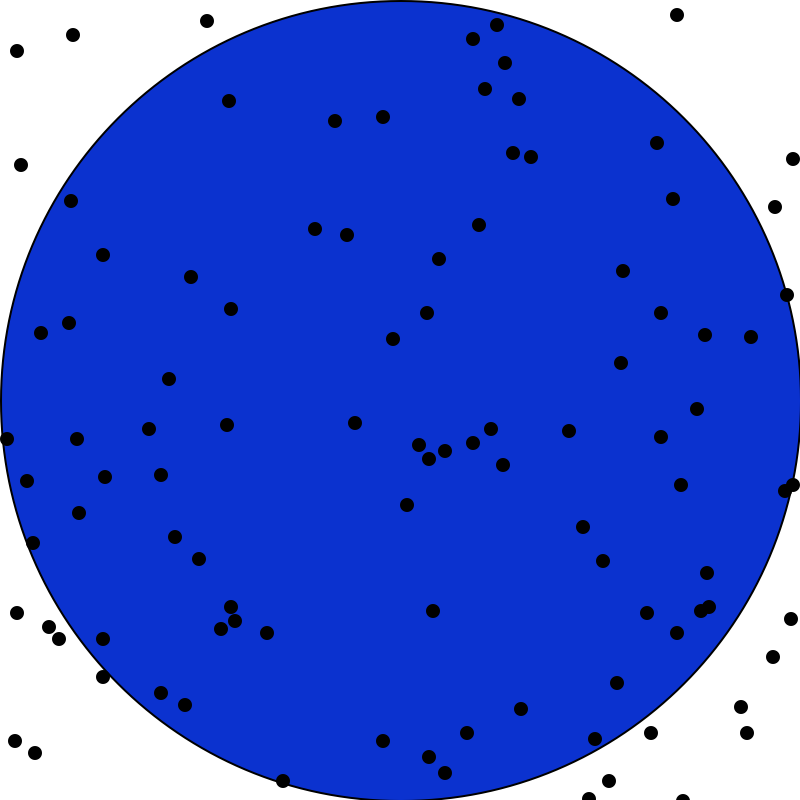
When we say we're using a Monte Carlo method, we usually mean we're going to do a bunch of random trials and observe the fraction of those trials that have a certain property. In our case, we're going to be throwing darts into a square region, and computing the fraction of those darts that land within a circle inscribed inside that square. Each throw is a trial, and the property we are concerned with is whether or not the dart landed inside the circle or not.
Describe the Problem: |
Write a program called monte.py that computes an approximate value of π. Input: A number of trials n from the user. Ouput: An approximation to π using a Monte Carlo method with n trials. |
Understand the Problem: |
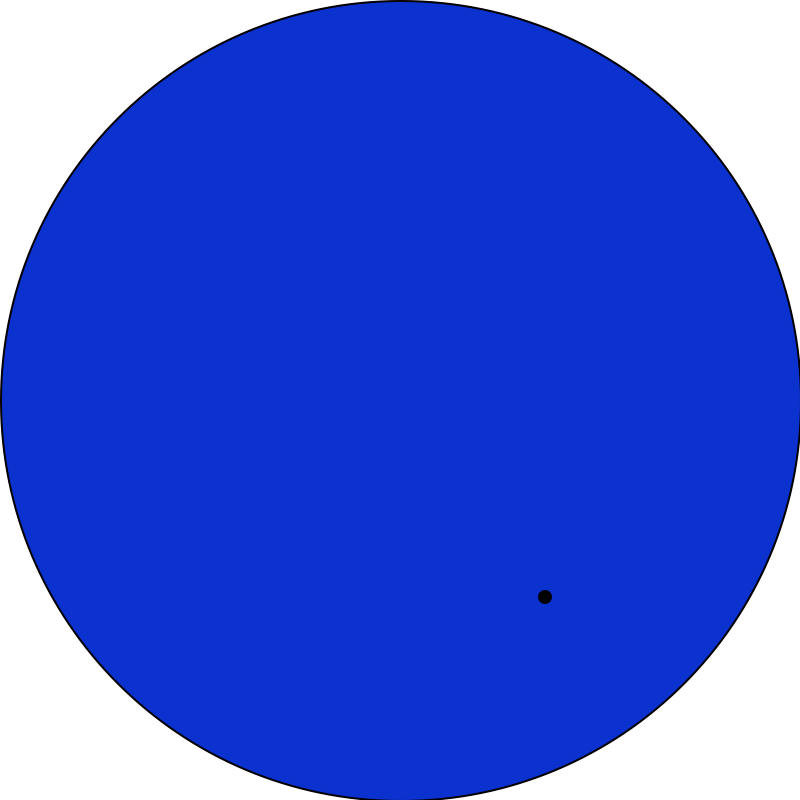
More precisely, we'll begin by (theoretically) constructing a target circle inscribed in a square. This is our dart board, and the target circle reaches all the way to the edge of the square. It might look something like the following:
The area of a square is the length of a side squared. Thus our square, with sides of length 2, has an area of 4. The area of a circle is π times the radius squared, so for a unit circle (with radius 1), the area is π. Therefore, the ratio of the area of our circle to the area of our square is precisely π/4. (That is, the circle takes up a π/4 portion of our dart board.) Since each dart lands at a random location in the square, the probability that any one dart lands within the circle should be exactly the fraction of the square taken up by the circle: π/4. Thus, if we repeat this experiment over and over again, we'd expect roughly a π/4 fraction of the darts to land in the circle. By counting up the fraction that actually land in the circle in our experiments, we've gotten a probabilistic estimate for π/4, or a quarter of π. If we just multiply that estimate by 4, we've got our approximation for π itself. Restating our discussion as a formula, we have
A run of the program might appear as follows.
% python3 monte.py
This program calculates the value of π by
simulating the throwing of darts onto a round
target on a square background.
How many darts to throw? 1
The value of π after 1 iterations is 4.0
|
Design an Algorithm: |
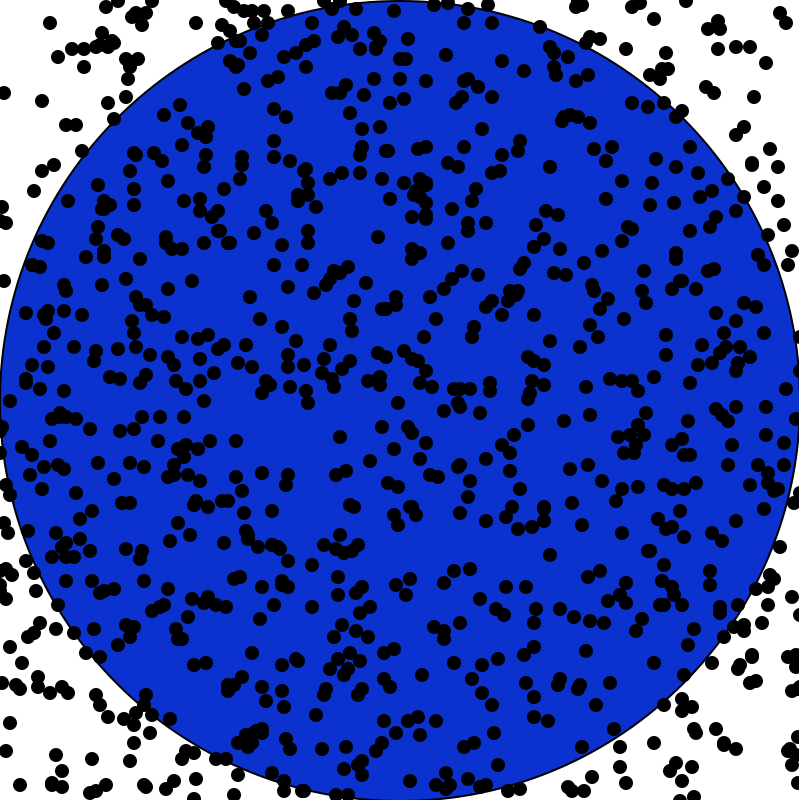
Write pseudocode to approximate π via this dart-throwing method — you'll throw random darts at a 400-by-400 board, and calculate what fraction end up within the circle enclosed by that board. Try this on your own, and then confirm that your pseudocode looks something like the following:
|
Implement a Design: |
Translate your pseudocode into a Python program named monte.py. In order to implement your pseudocode, you'll need to "throw a dart." Each dart's position is specified by an (x,y) coordinate, so to "throw" a dart, you just need to randomly generate two values for each dart throw (one for x and one for y). Generating random numbers / Throwing random dartsPython has a module that will let you generate random numbers called random. To use it you need to:
Now that you have your dart throw, your next question should be: how do I know if I've hit the target? You'll do this by calculating the distance from the center of the circle to the dart and determining if it is within circle's radius and therefore inside the circle. The distance formula is given by:
Math moduleYou can gain access to the math module by including the statement: |
Test the Program: |
Try running your program with an increasing number of trials. Ideally, the more trials you have, the closer to the real value of π you get. You should expect that each run produces a slightly different value due to the fact that it is using a random number generator. |


Part 4 - Wrap Up
Congratulations! You have finished the third lab. As with every lab, your last job prior to submission is to complete a brief write-up by filling out a Google Form, which is also how you submit your Honor Code statement (so please do not forget to do this).
Handin
Finally, all you need to do is submit your solution to the assignment. To do so, please click on the "Submit" button in the top right of your programming environment. This will save all of your programs for myself and the graders to look at. You are welcome and encouraged to submit partial solutions to your assignment -- you can always resubmit by pushing the "Resubmit" button in the top right, which will save the latest version of your programs. We will only grade the latest version that you submitted. By submitting multiple times, you avoid accidentially forgetting to turn in any completed part of your assignment, especially in case you become busy around the lab due date.
A. Eck, A. Sharp, T. Wexler, M. Davis, and S. Zheng.